Data analysis with R
Data analysis with R is a powerful approach, making it a popular choice among statisticians and data scientists. Example of data analysis using R, utilizing a dataset of student exam scores.

Firstly, we need to import the dataset into R. Assuming our dataset is in a CSV file named "scores.csv," we can use the `read.csv` function:
# Read the dataset
data <- read.csv("exam_scores.csv")
# Display the first few rows of the dataset
head(data)
# Summarize the dataset
summary(data)
# Calculate the average score
average_score <- mean(data$Score)
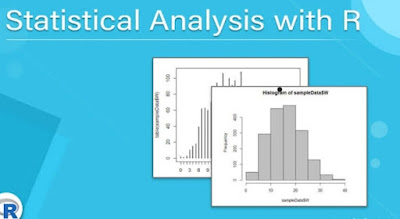
To visualize the distribution of scores, we can create a histogram:
# Create a histogram
hist(data$Score, main = "Exam Score Distribution", xlab = "Score")
We can create a scatter plot:
# Create a scatter plot
plot(data$StudyHours, data$Score, main = "Study Hours vs. Exam Score", xlab = "Study Hours", ylab = "Score")

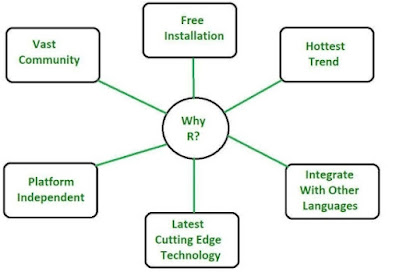
These are just the basics; R offers a wide range of packages and functions for more advanced analyses, including statistical tests, machine learning, and data visualization. Learning R can empower us to gain valuable insights from data and make informed decisions.


Comments
Post a Comment